Blended Wing Aircraft Design
Overview
This project focuses on the design and aerodynamic analysis of a Blended Wing Body (BWB) aircraft. The BWB configuration offers significant improvements in fuel efficiency and lift-to-drag ratio compared to conventional tube-and-wing aircraft.
Objectives
- Design a BWB geometry to model aerodynamic characteristics
- Analyze lift distribution and stability characteristics
- Perform wind tunnel experiments to validate aerodynamic performance
- Compare performance metrics against conventional BWB aircraft
Approach
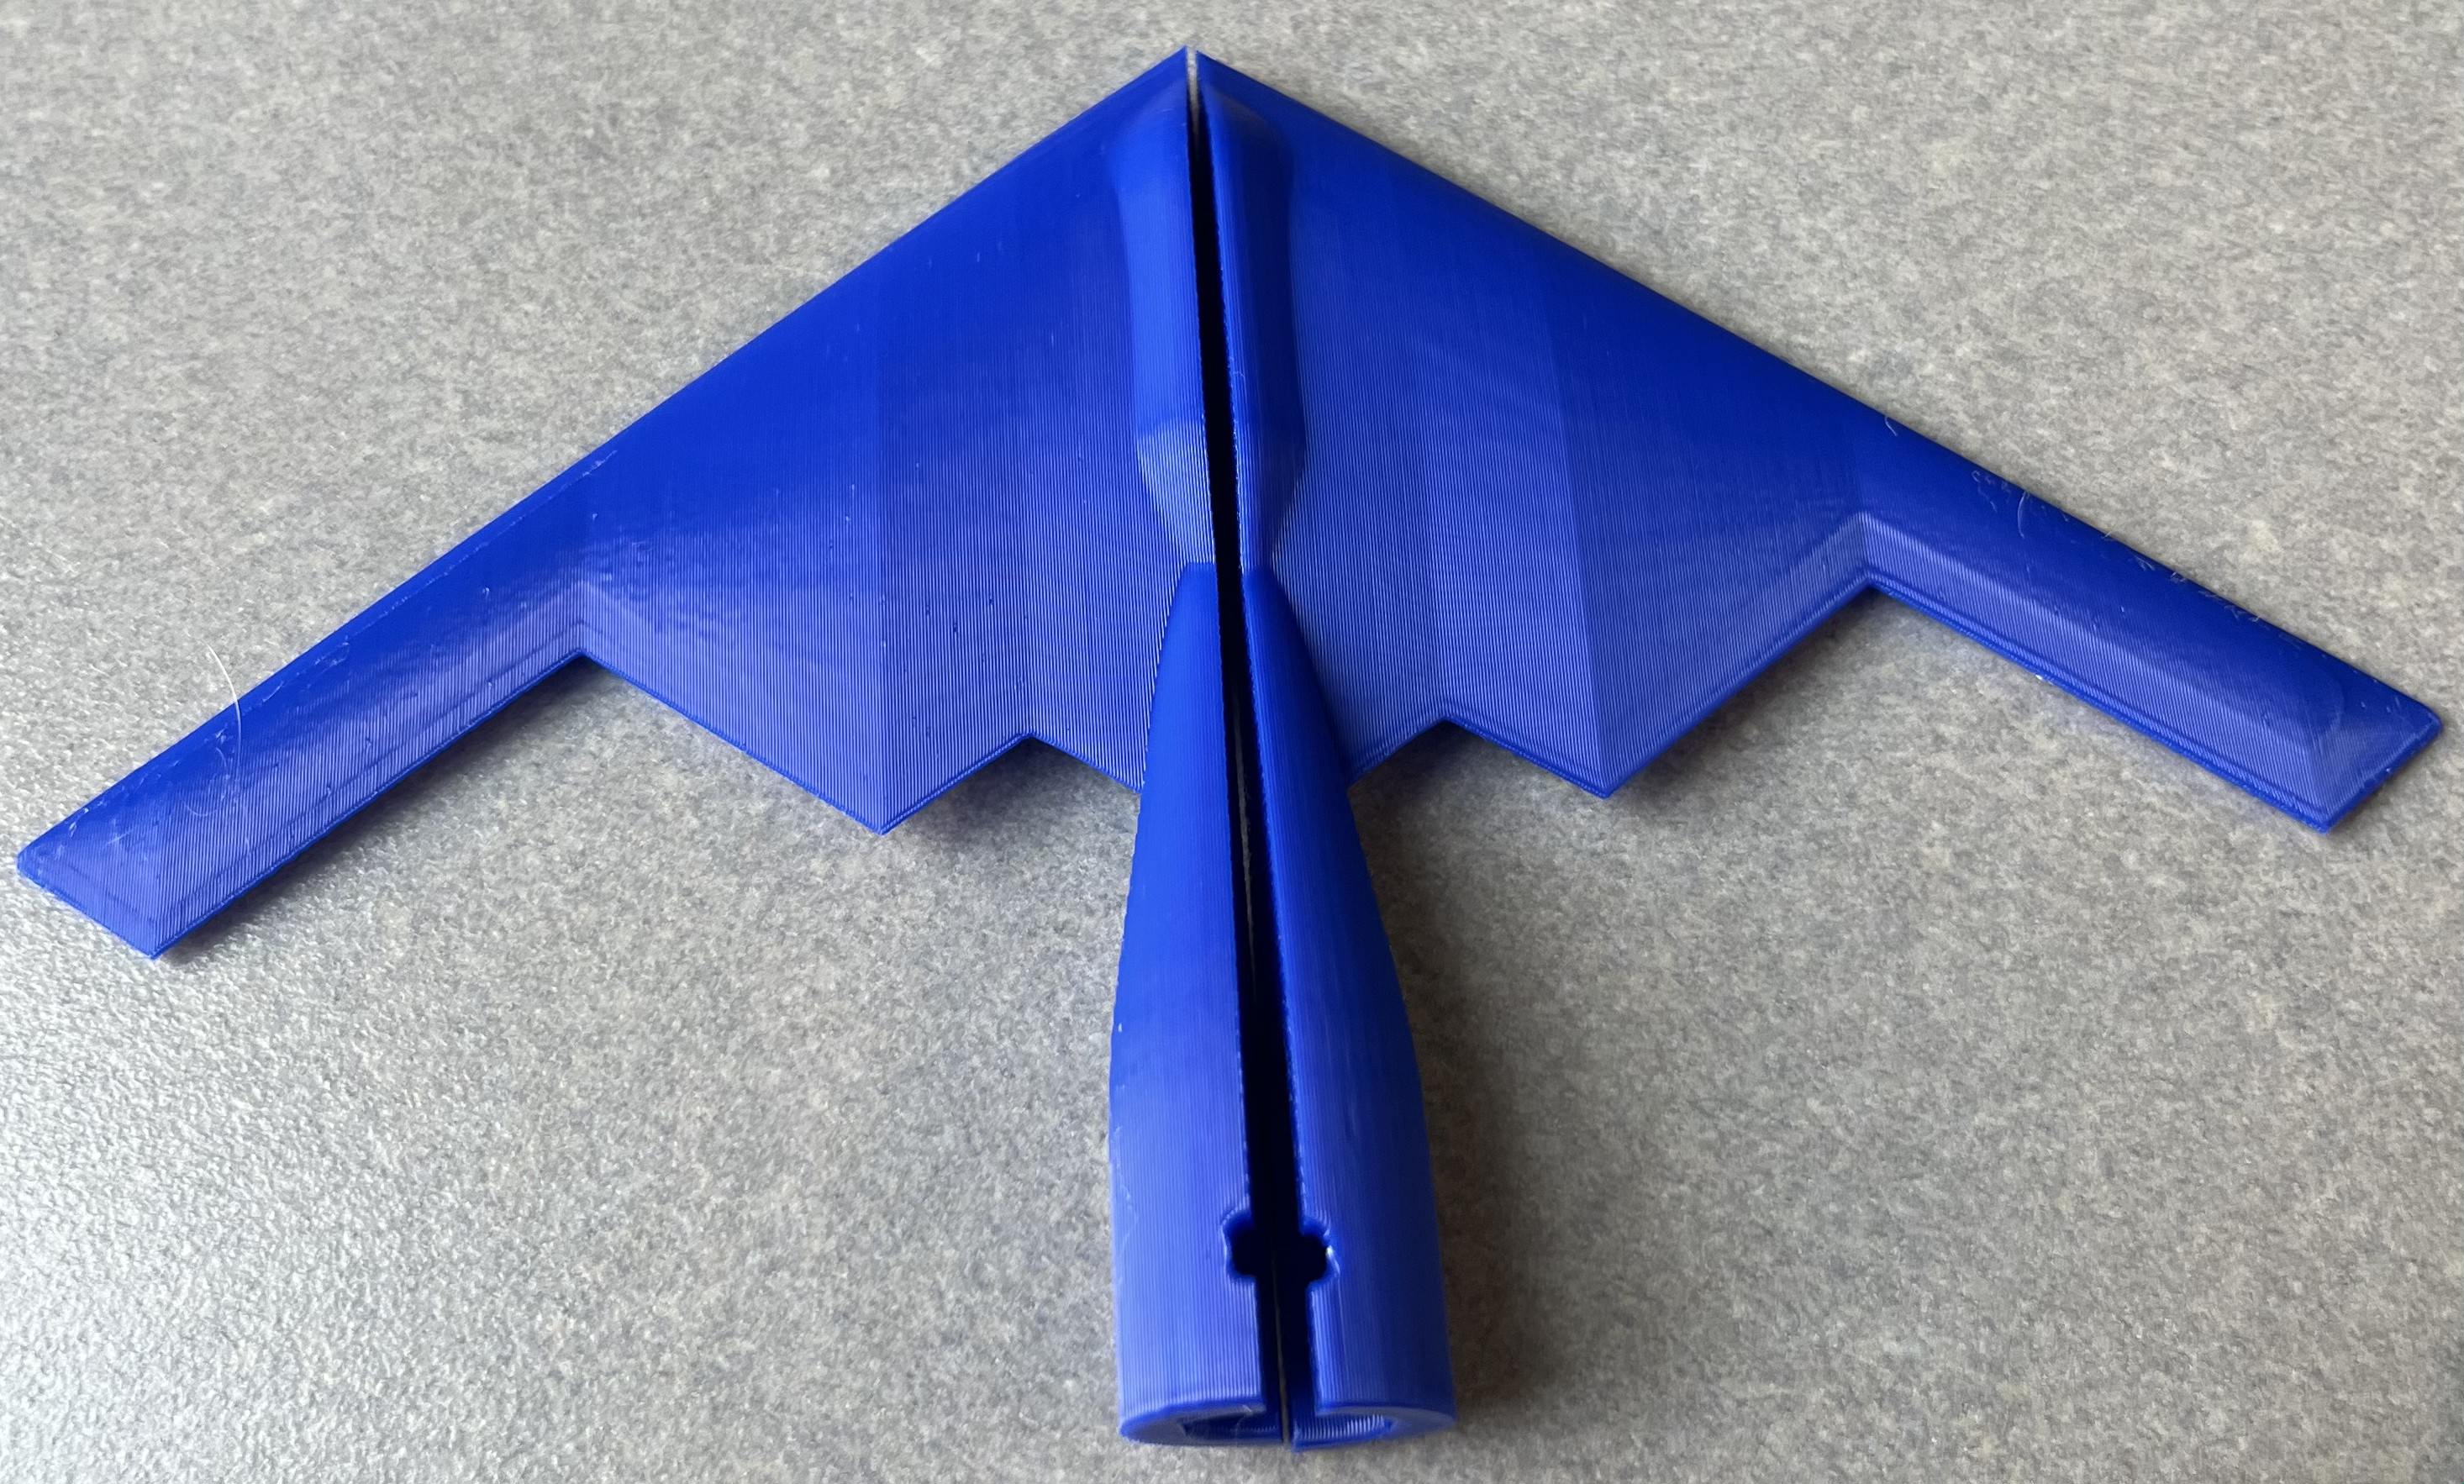
The initial design of our blended wing body was modeled of off the B-2 Spirit aircraft, our model was scaled down by a factor of approximately 350. The scale model uses a NACA 2413 airfoil to attempt to accuratly replicate the B-2 Spirit. The model was then 3D printed using a Bambu Lab printer with PLA filament. Basic aerodynamic parameters such as Reynolds number, skin friction coefficient, skin friction drag, coefficient of lift/drag/moment, and Mach number were calculated for our scale model. Using a wind tunnel and a sting balance, we were able to position our scale model inside our wind tunnel and measure the normal force, axial force, and pitching moment.
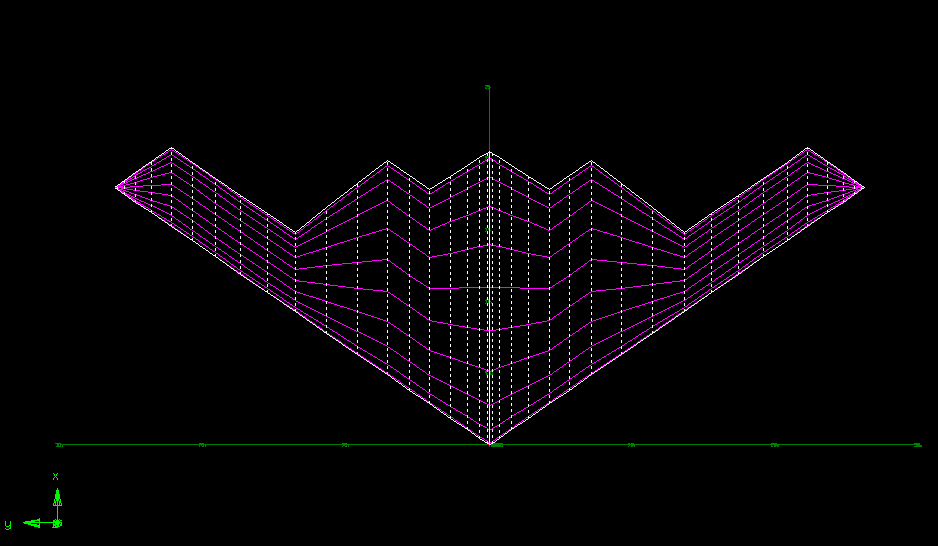
To verify the design, Athena Vortex Lattice (AVL) is used to perform a preliminary aerodynamic
analysis of the aircraft. AVL is a computational fluid dynamics tool developed by MIT for
predicting
the aerodynamic performance of aircraft using the vortex lattice method. It models lifting
surfaces
with discretized vortex panels, enabling rapid calculation of lift distribution, stability
derivatives,
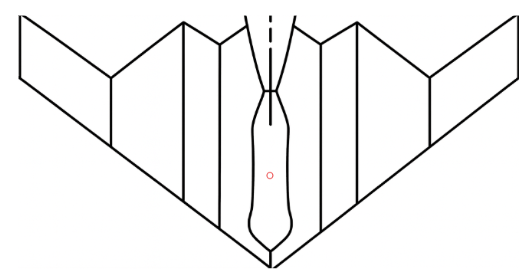
and control effectiveness. Figure 1 shows the BWB aircraft model in AVL.
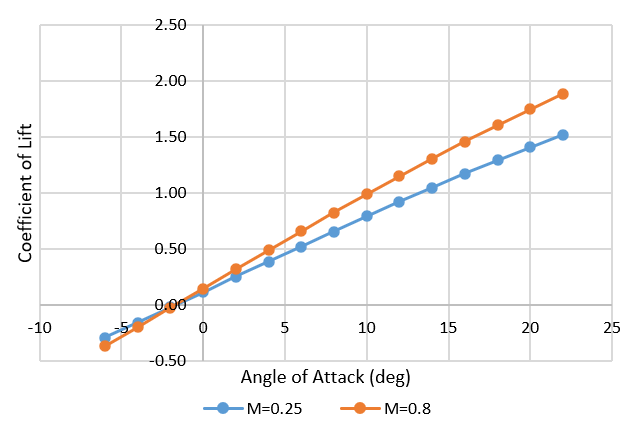
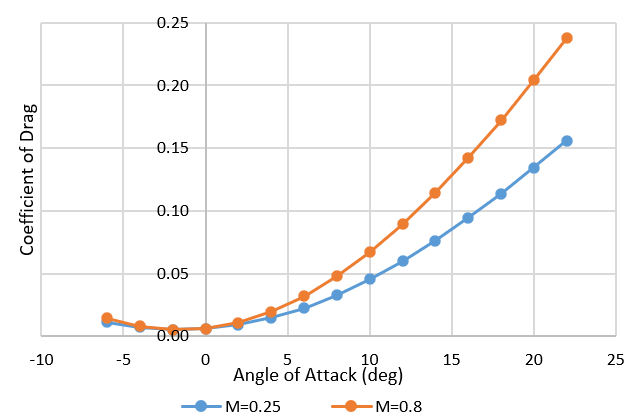
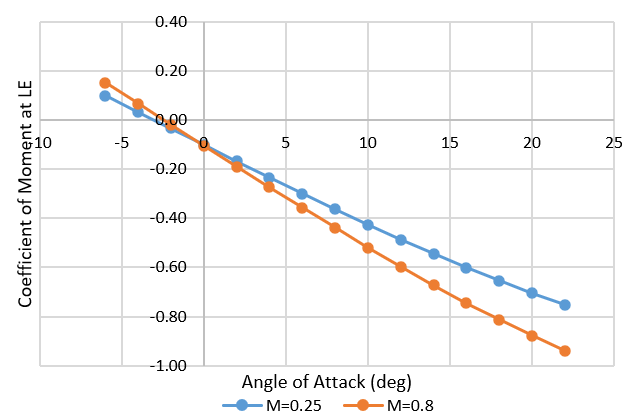
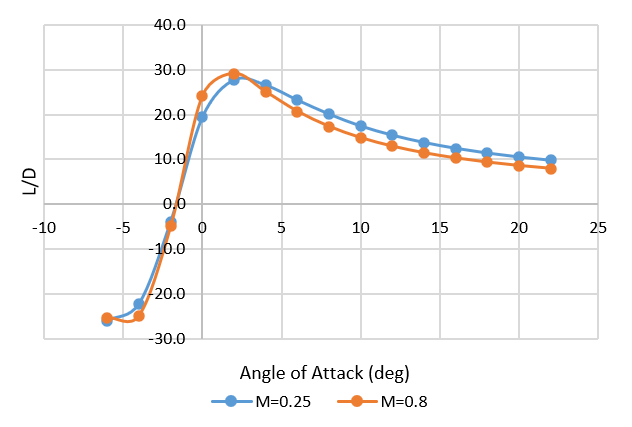
To conduct the preliminary aerodynamic analysis, two flight envelopes were chosen: cruising and takeoff. Using AVL, The Angle of Attack range is selected from -6 degrees to 22 degrees in increments of 2 degrees. Figure 2 shows the coefficient of lift, coefficient of drag, coefficient of moment at the leading edge, and the lift to drag ratio for each angle of attack using AVL.
The normal force, axial force, and pitching moment, which were measured relative to the balance center on the sting 0.62 inches behind the setscrew, were calculated. Each of the parameters were measured at three wind tunnel speeds: 40, 60, and 80 feet per second.Trends in axial force, normal force, and pitching moment can be better visualized through plots for the three velocities. These results can be seen in Figures 3, 4, and 5.
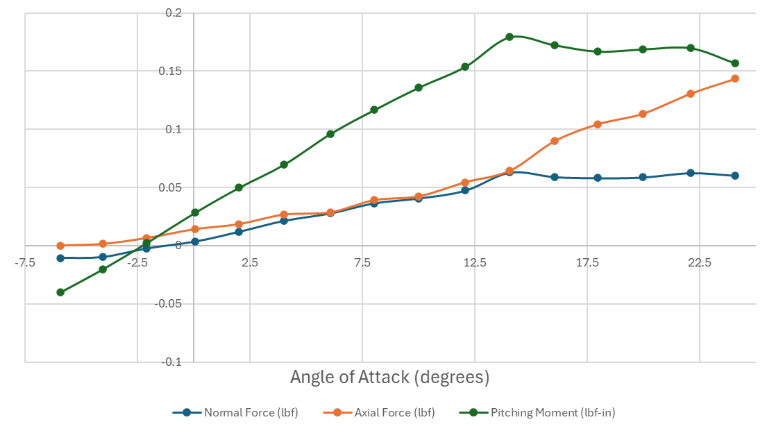
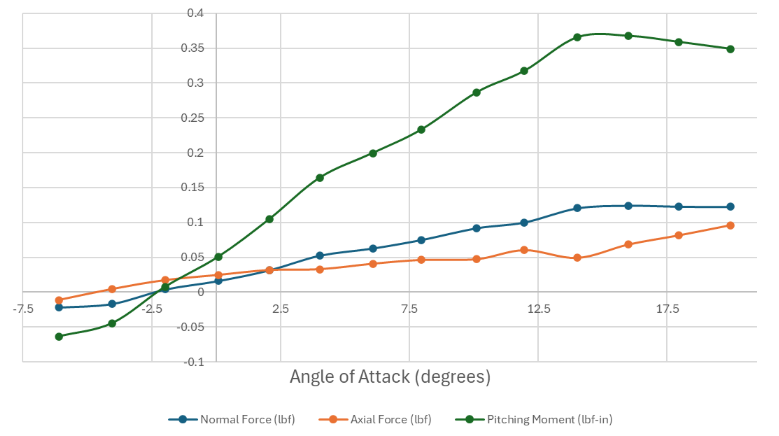
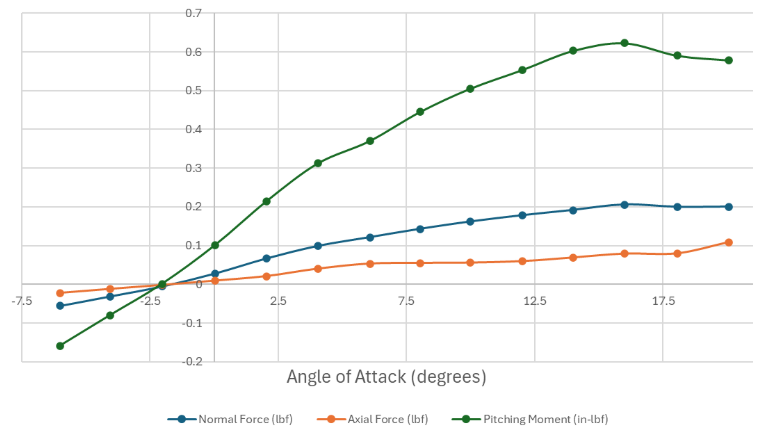
There are several notable trends that can be seen from this data. For one, the slopes of all of these values with respect to the angle of attack increase as wind tunnel velocity and Reynolds number increase. The reason for this is that these forces and moments scale with dynamic pressure, which increases with the square of velocity. To determine the neutral point of the aircraft, we can plot the pitching moment coefficient with respect to the angle of attack. The point where the pitching moment coefficient is equal to zero is the neutral point. Figure 6 shows the location of the neutral point on the aircraft.
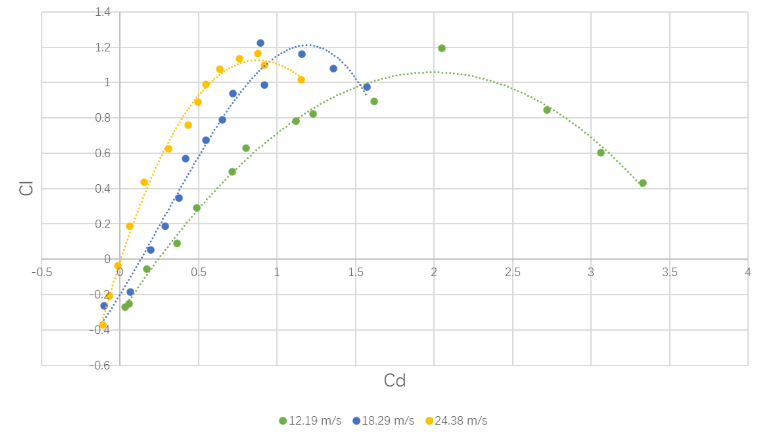
Using the wind tunnel data, we can plot the lift and coefficients with respect to the angle of attack. Additionally, we can plot the L/D for varying angles of attack and the drag polar. Figure 7 shows all of these relationships.
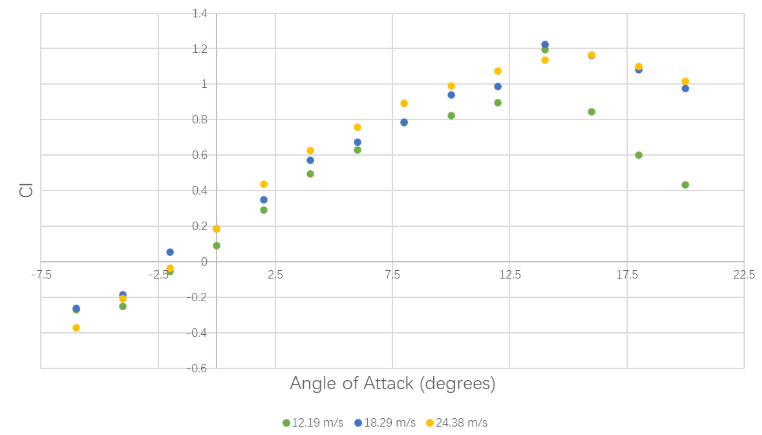
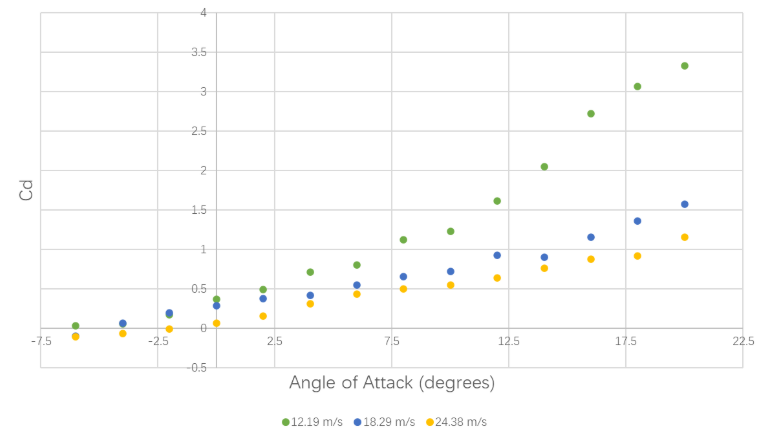
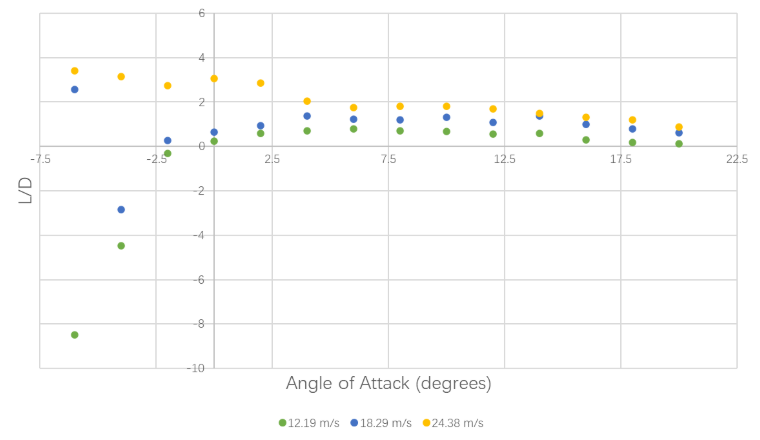
Looking at Figure 7, the lift curve plot would suggest that the aircraft stalls at about 14 degrees angle of attack, and this is roughly consistent with the stall in the moment coefficient seen previously. Generally, a trend can be seen that more lift is generated at higher velocities and, therefore, higher Reynolds numbers. Looking at the drag plot, there is more drag at lower Reynolds numbers. This is because at lower Reynolds numbers, flow is more laminar and skin friction is higher because skin friction increases with Reynolds number.
Looking at the lift to drag ratio plot, the L/D is higher for higher Reynolds numbers. Finally, looking at the drag polar, the drag polar slope increases at higher Reynolds numbers. The slope reflects the heavy contribution of lift to total drag.
Looking at the full-scale aircraft's geometry, it is fairly consistent with the scaled-down model's geometry. The full-scale B-2 is unique in its exclusion of a vertical stabilizer: an important control surface for yaw stability. Instead, the B-2 uses three sets of elevons for pitch and roll control, and upper/lower drag rudders for yaw control. Due to the absence of such a critical control surface in the vertical stabilizer, the B-2 utilizes an active flight control system and a fly-by-wire system to allow for maximum control. This lack of control surfaces and a vertical stabilizer results in an inherent instability in pitching moments experienced by the aircraft.
As the AVL design verification suggested, the B-2 wing configuration is sufficient to produce lift during takeoff and cruise. However, landing is slightly more complicated with wings similar to the full-scale. Similar to gliders, the full-scale is more susceptible to "ground effect": the phenomenon where wings close to the ground experience increased lift effects and reduced drag, creating a cushion of high-pressure air. This effect, while minimal in traditional aircraft, is amplified by the size of the wings on the full-scale model. Therefore, complex control systems and experienced pilots are needed to land the aircraft safely. Looking at the experimental data it is clear that the scale model has better aerodynamic properties at higher speeds. This is more akin to conditions experienced during takeoff when speeds are higher, rather than landing when the aircraft slows down. This supports the conclusion that the aircraft performs better at takeoff conditions than landing conditions. Regardless of this bias in performance, the wing configuration on the full-scale model produces sufficient lift for take-off and landing.
Conclusion
Analyzing the aerodynamic properties of the scale model at different wind tunnel regimes and angles of attack gives valuable data on the correlation between the scale and full-scale models. First, the design is verified using an aerodynamic analysis tool, AVL, to perform a preliminary analysis prior to raw data analysis. Comparing AVL data to experimental data shows a close match between the two data sets, reinforcing the validity of the experiment and verifying that the aircraft meets basic lift, drag, and stability requirements for both takeoff and cruise.