Parametrization of an Aileron
Overview
This project focuses on the parametric design and analysis of aileron geometry to achieve optimized aerodynamic performance. By defining key geometric parameters and studying their effects on lift, drag, and control authority, the project establishes a systematic approach to aileron design.
Objectives
- Define a comprehensive set of geometric parameters for aileron design
- Develop a parametric CAD model for rapid design iteration
- Analyze the aerodynamic effects of parameter variations
- Optimize aileron geometry for improved performance
Approach
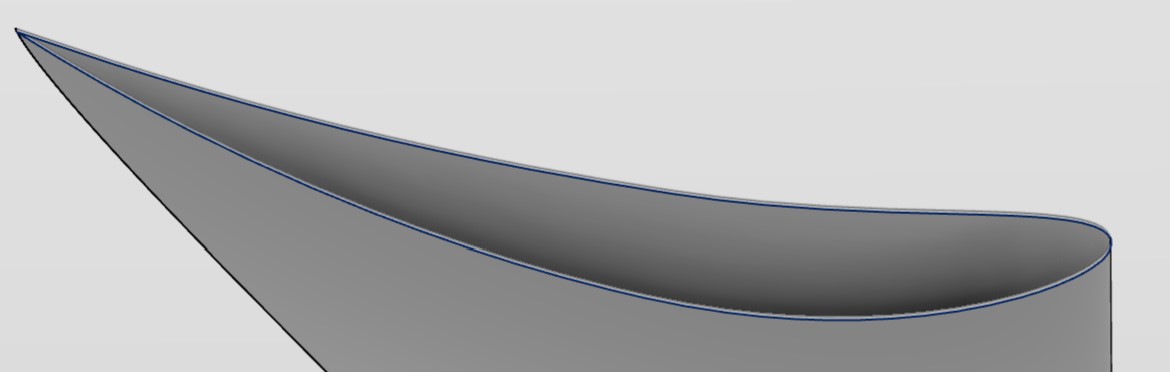
The aileron geometry was parametrized using key variables including maximum camber, location of maxium camber, maxium thickness, chord length, angle of incidence, and spoiler length. A parametric CAD model was developed to enable rapid exploration of the design space and facilitate iterative analysis.
To determine the forces acting on the airfoil, a CFD analysis was conducted. The CFD analysis allowed for a clearer view of the fluid motion surrounding the airfoil. Additionally, it allowed for relationships to be made between the parameters and the outputs.
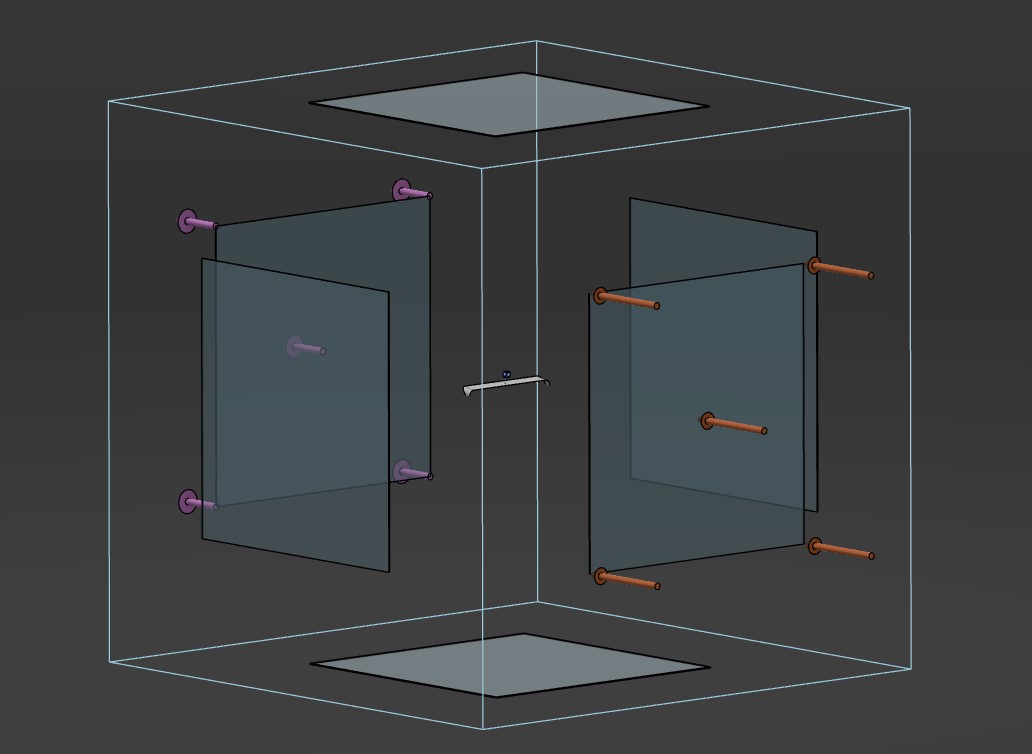
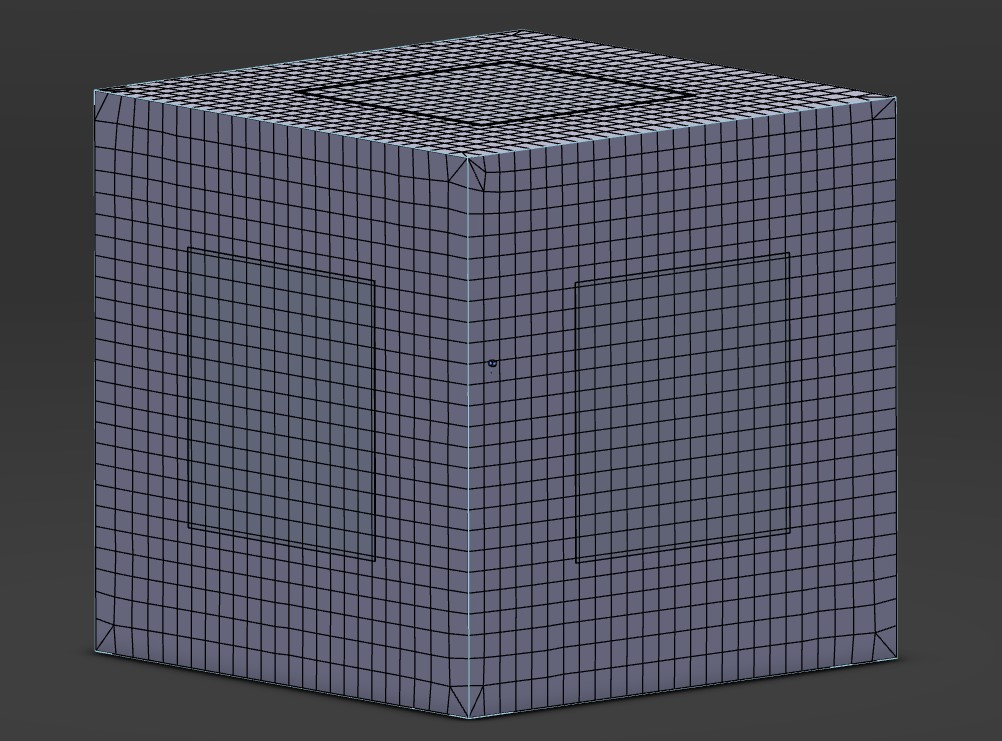
The first step was to
choose a fluid domain that would serve as a region of airflow around the airfoil. This domain
was specified under a bounding box at a specified dimension to avoid near wall effects. After
defining the boundary box dimensions, the wall boundaries were given specific characteristics.
One was designated as the pressure outlet while the other was designated as the velocity inlet
with a value of 43 m/s. Figure 1 shows the fluid domain with the
aileron in the center.
After performing a CFD simulation, values for lift and drag were outputted. Lift values were in the negative region as the aileron's primary purpose is to generate downwards lift or downforce. Once these values were determined, 3DExperience's optimization software was used to optimize lift and drag in terms of the chord length and angle of incidence.
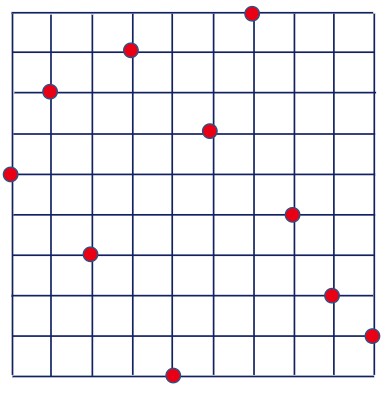
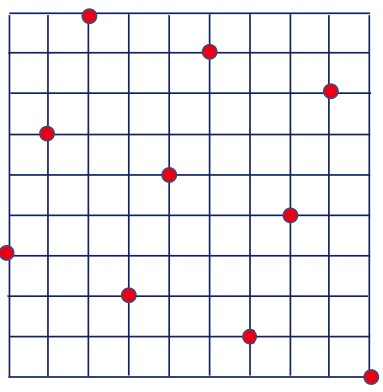
The optimization process was done using two methods: Optimal Latin Hypercube and Full Factorial. Latin Hypercube is a derivation of Latin Hypercube Sampling (LHS) that further optimizatizes the random sampling process. Figure 3 shows the data point distribution for LHS.
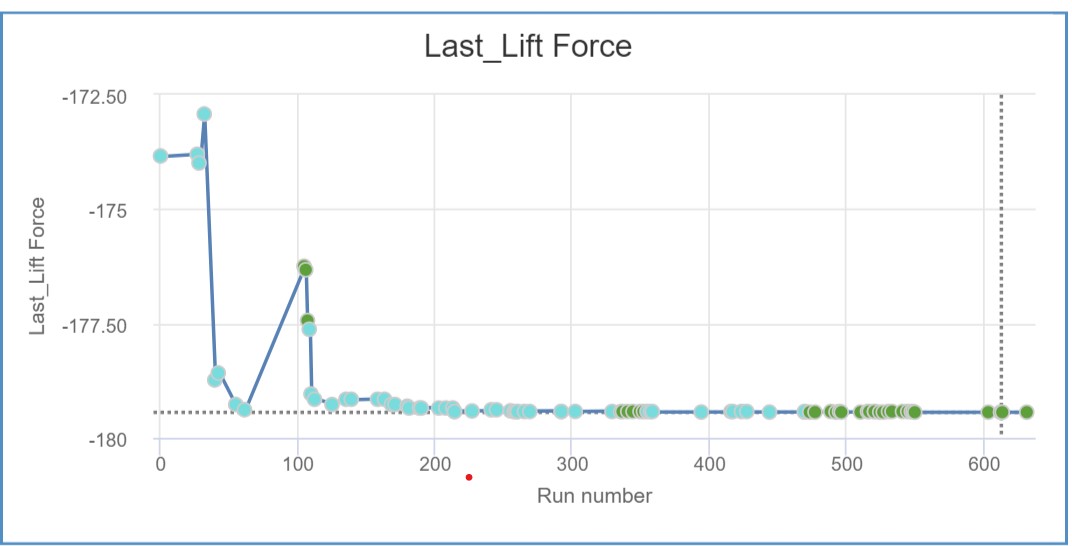
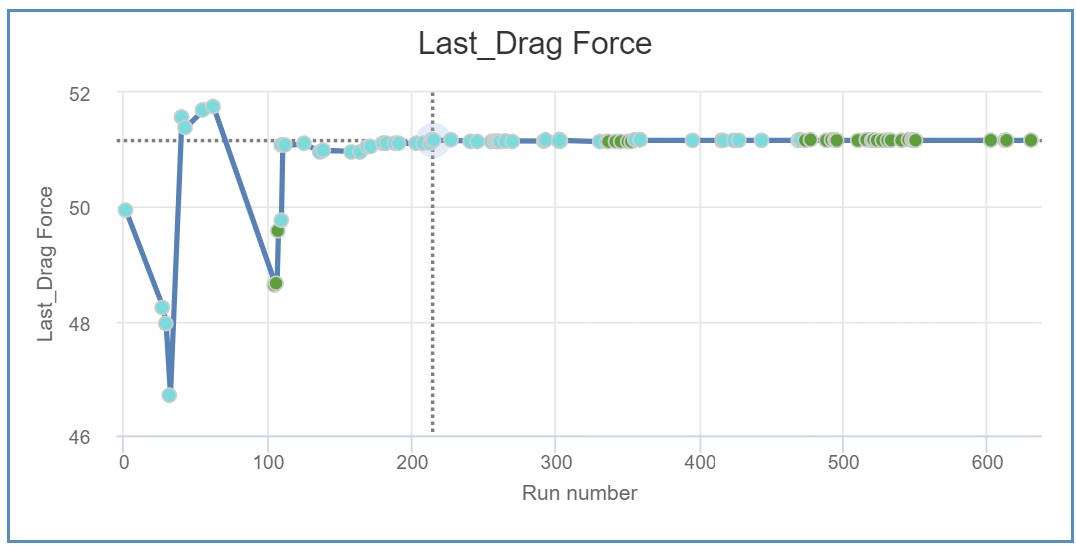
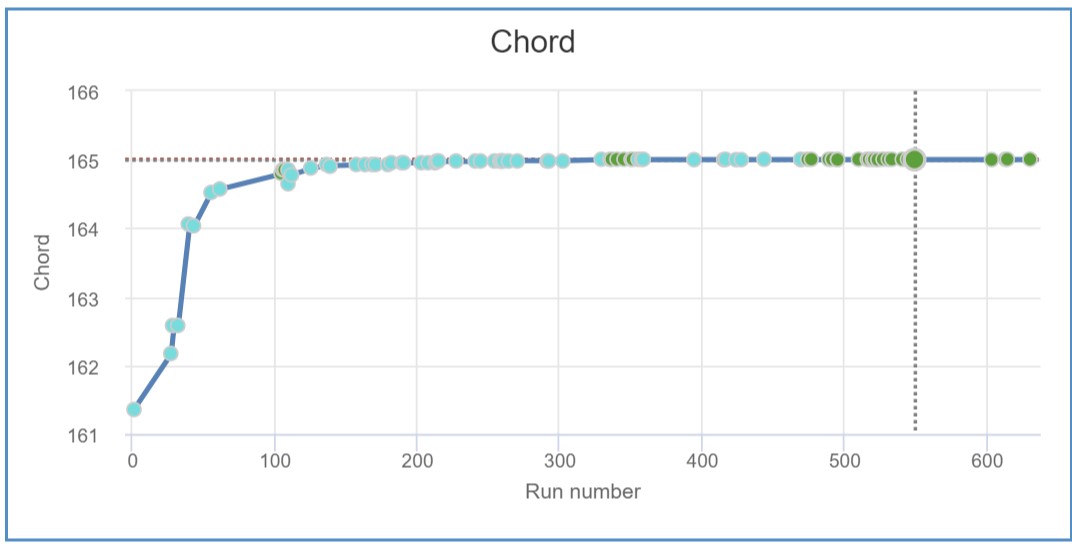
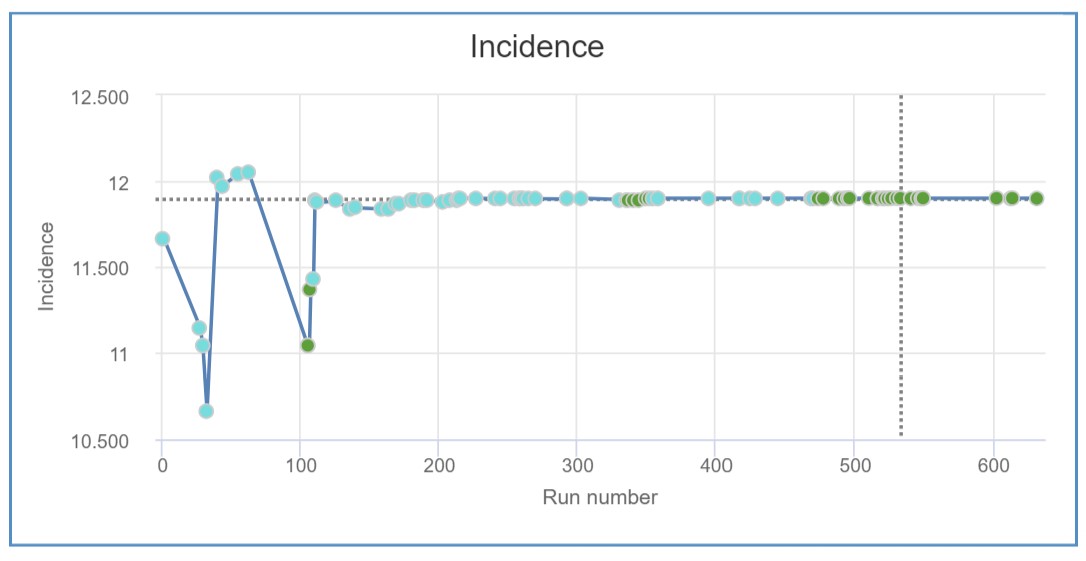
The optimal design was determined to be a chord length of 165 mm, a incidence of 11.9 degrees, a lift or downforce value of -179.44 N, and a drag value of 51.164 N.
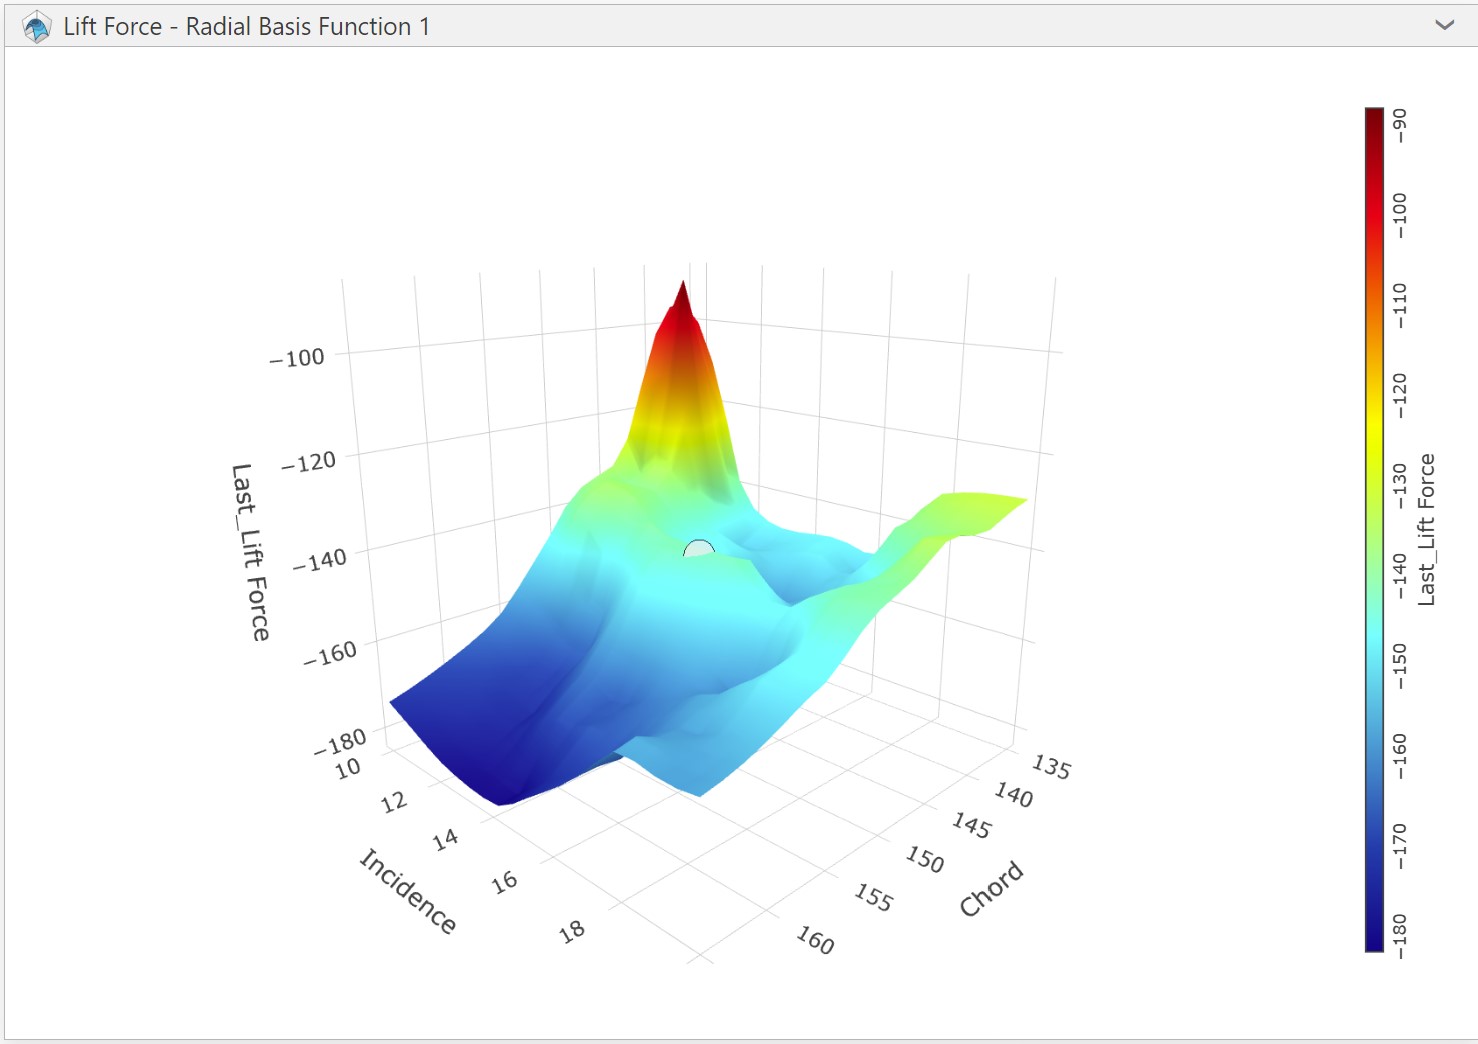
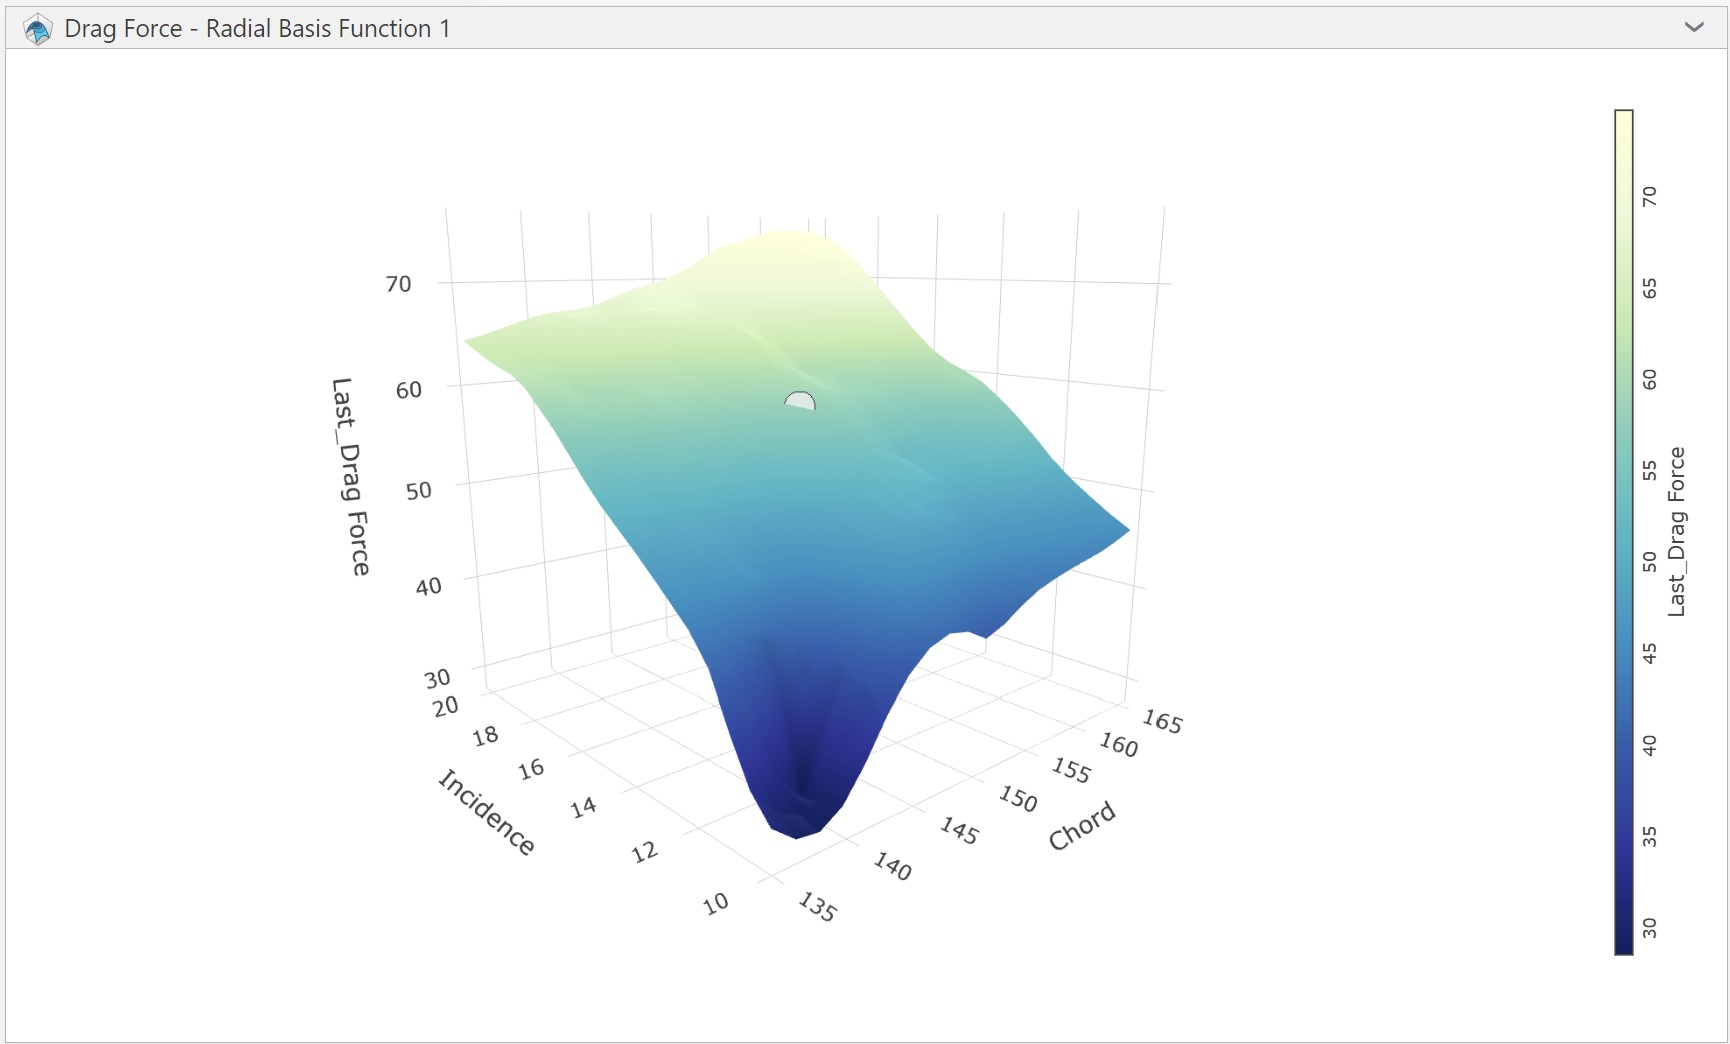
The lift and drag values were plotted using response surface models (RSM), which map the relationship between multiple variables and the output. RSMs offer a 3-dimensional view of the data set. The RSMs produced using the Design of Experiments software display a heatmap of the data, allowing for easy identification of peaks and valleys.
Each RSM shows the design point stated earlier. Figure 9 shows the RSM for lift.
Results
The parametric study revealed the relationships between geometric parameters and aerodynamic performance metrics. The findings provide valuable design guidelines for aileron configuration in various flight configurations.